Research · IEEE CHANDICON 2026
Predicting space debris collision risk with machine learning
The paper: Machine Learning Prediction of Space Debris Collision Risk Using Orbital Data. It asks whether a model can tell high-risk satellite situations from low-risk ones using only public orbital data.
Neel Prasad (Round Rock High School) with Subham Kumar Jalan and Kavitha Sharanappa Gudadur (iResearcher). Presented at the 2026 IEEE Chandigarh Subsection International Conference, hosted by Punjab Engineering College, Chandigarh, August 20 to 22, 2026.
At a glance
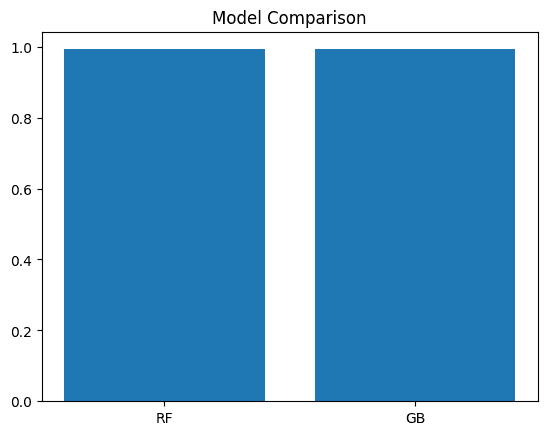
- 0.99
- accuracy, precision, recall and F1 for both Random Forest and Gradient Boosting
- 138 of 139
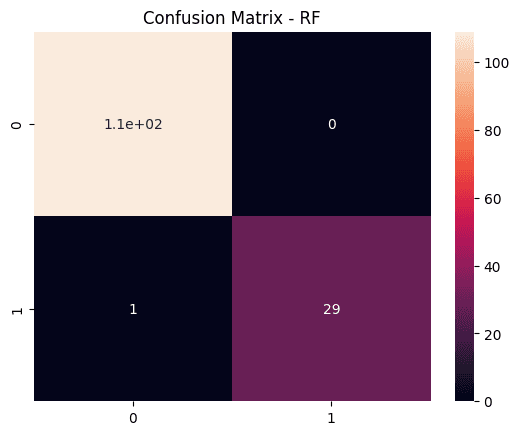
- test cases classified correctly by the Random Forest (109 low-risk, 30 high-risk)
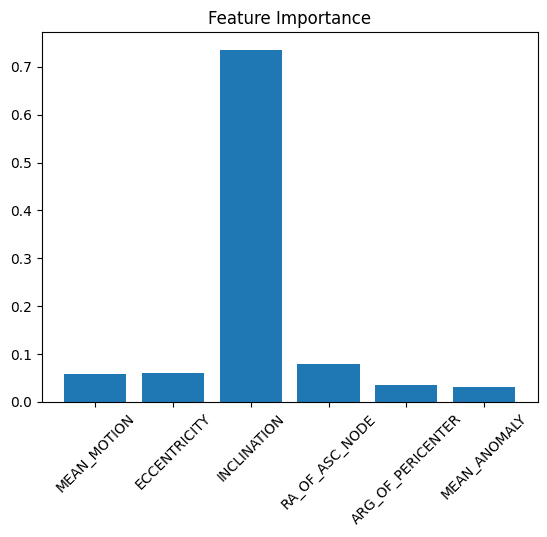
- Inclination
- the orbital parameter that mattered most in predicting risk
Why it matters
The number of satellites and debris objects in low Earth orbit has grown fast, and more objects mean more chances of collision. A collision can damage working satellites and create new debris, and even tiny fragments are dangerous because of their speed.
Most existing collision prediction relies on mathematical calculations and fixed warning thresholds. They still work, but they are getting harder to apply as the amount of orbital data grows. This paper tests whether machine learning can help with satellite monitoring and space traffic management.
How it was done
- 01
Data
Two-Line Element (TLE) orbital records from public CelesTrak repositories. They are openly available and widely used in satellite tracking, so others can reproduce the work.
- 02
Preprocessing
Converted the raw line-format TLE text into a table with Pandas. Pulled out inclination, eccentricity, mean motion, right ascension of the ascending node, argument of perigee and mean anomaly. Collision risk labels came from a weighted orbital risk score.
- 03
Analysis
Distribution plots, correlation analysis, scatter plots and boxplots to understand the data and spot unusual values, then feature importance to see which parameters drive the prediction.
- 04
Models
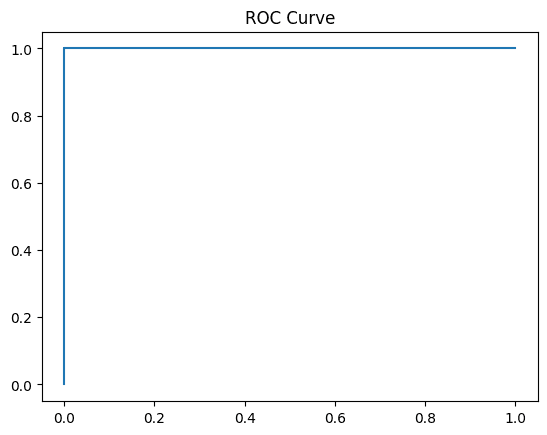
Random Forest and Gradient Boosting classifiers sorted cases into low-risk and high-risk, trained on a training split and judged on a held-out test split with accuracy, precision, recall, F1, confusion matrices and ROC curves.
The orbital data
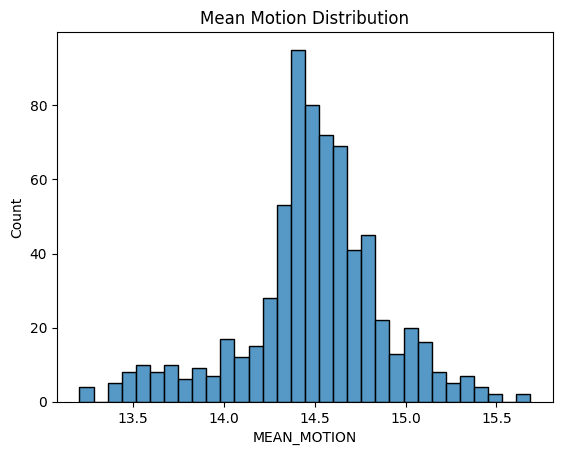
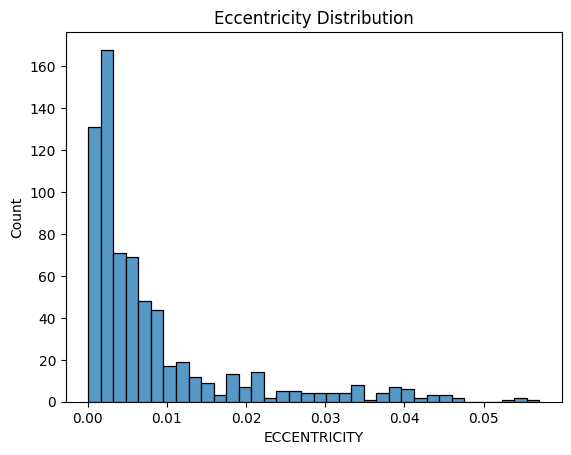
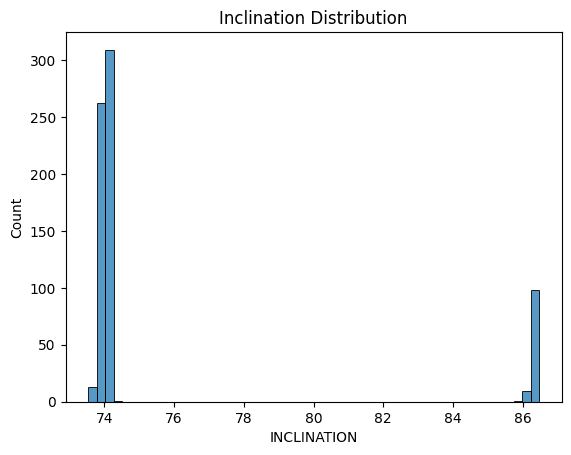
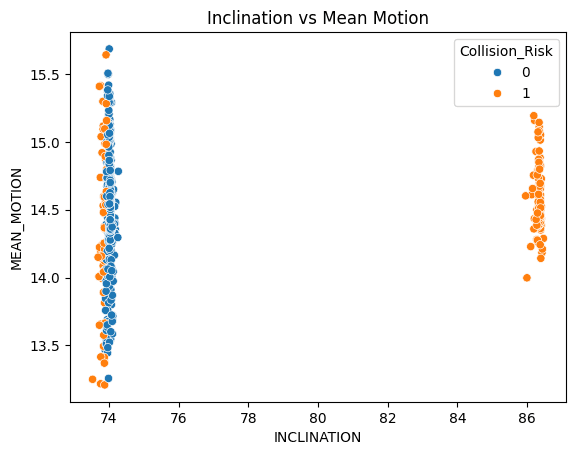
Most satellites in the dataset sit in low, nearly circular orbits, and their inclinations fall into planned bands.
What relates to risk
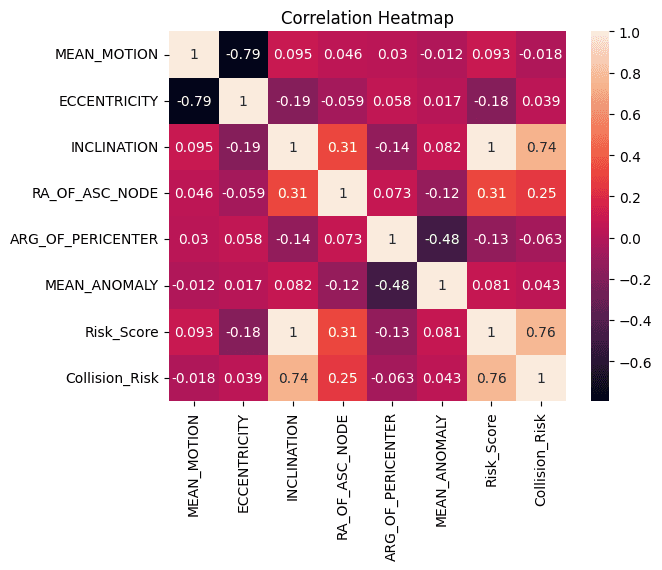
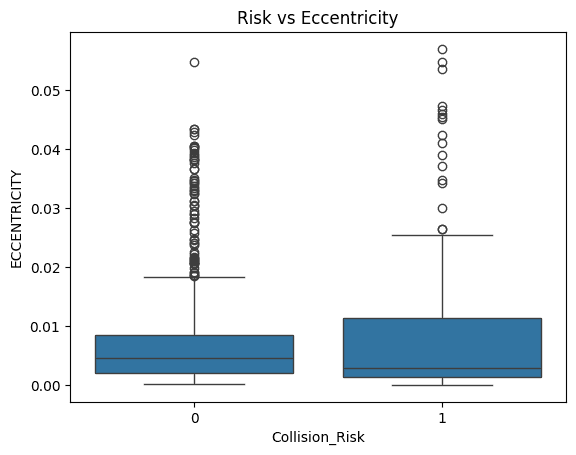
Inclination showed the strongest link to collision risk. Eccentricity showed a wider spread in the high-risk group.
How the models did
Both models performed almost identically. On the Random Forest confusion matrix, one high-risk case was missed and there were no false alarms.
| Model | Accuracy | Precision | Recall | F1-score |
|---|---|---|---|---|
| Random Forest | 0.99 | 0.99 | 0.99 | 0.99 |
| Gradient Boosting | 0.99 | 0.99 | 0.99 | 0.99 |
Limits and next steps
The paper is open about one limit. The risk labels come from a simplified weighted score of orbital parameters, not from real collision events. That helps explain how clean the results are, so they show the approach is workable, not that it is ready for operations.
- Use larger datasets.
- Use real conjunction event records.
- Try graph-based learning models.
- Add time-dependent orbital prediction.
Presented at IEEE CHANDICON 2026